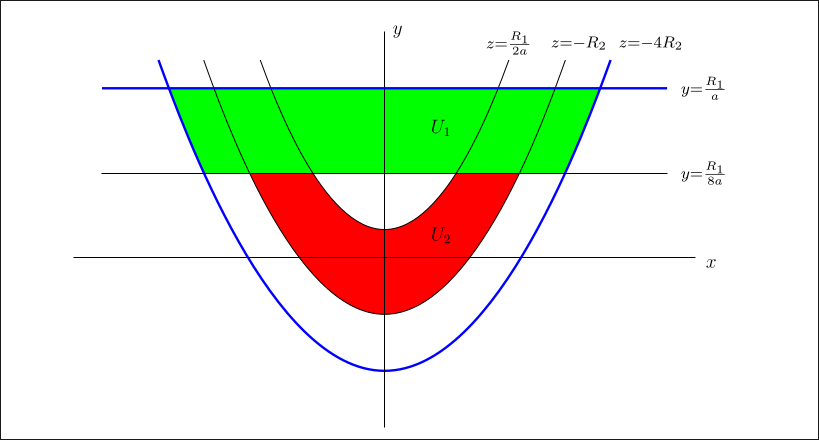
According to Francini et al. the domains look like depicted in this image. \(U_1\) and \(U_2\) are shown in green and red, respectively. The domain \(U_3\) is enclosed by the blue boundaries. However, the plot seems to be wrong!
According to Francini et al. the domains look like depicted in this image. \(U_1\) and \(U_2\) are shown in green and red, respectively. The domain \(U_3\) is enclosed by the blue boundaries. However, the plot seems to be wrong!